Elasticsearch is widely adopted for indexing and searching large data volumes, but its openness can also pose risks when sensitive data is involved. To address this, Elasticsearch includes a detailed audit framework that records who accessed data, what operations were performed, and whether those operations were authorized. This continuous visibility ensures accountability and compliance with security regulations.
Organizations handling regulated data must also comply with standards such as GDPR, HIPAA, and PCI DSS. A well-configured audit trail in Elasticsearch helps prove compliance and detect abnormal access early.
This article explains what an Elasticsearch audit trail is, how to enable it natively, and how DataSunrise extends these capabilities with advanced, centralized audit management.
What Is Audit Trail?
An audit trail is a chronological sequence of records that documents all activities affecting data, systems, and configurations. It provides a transparent way to verify who did what, when, from where, and with what outcome.
In modern IT environments, audit trails serve as a foundation for both security and compliance—they capture critical evidence that helps identify unauthorized actions, verify adherence to internal policies, and support forensic investigations after incidents.
Audit trails generally include:
- User identification: Who initiated the action (user, role, or service account).
- Timestamp and origin: When and from where the activity occurred.
- Action performed: What operation was executed—query, modification, configuration change, or access attempt.
- Outcome: Whether the operation was successful, denied, or failed due to security restrictions.
In Elasticsearch, audit trails record authentication, authorization, and data access events that occur within the cluster. These logs help administrators maintain accountability and demonstrate compliance with industry regulations.
A well-maintained audit trail ensures data integrity, supports continuous monitoring, and strengthens overall governance across distributed systems.
Learn more about Audit Logs, Audit Rules, and Database Activity Monitoring to understand how audit trails fit into broader compliance workflows.
Enabling Native Elasticsearch Audit Trail
Elasticsearch audit logging is provided through X-Pack Security, which allows flexible configuration of log collection. Administrators can specify what events to include or exclude to reduce noise and focus on high-value security events.
Step 1: Enable Audit Logging
Add or modify the following settings in your elasticsearch.yml configuration file:
xpack.security.enabled: true
xpack.security.audit.enabled: true
xpack.security.audit.outputs: [logfile]
Restart Elasticsearch after saving the configuration. This enables basic audit event logging.
Step 2: Filter and Customize Logged Events
To fine-tune captured activity:
xpack.security.audit.logfile.events.include: ["authentication_success", "access_granted", "access_denied"]
xpack.security.audit.logfile.events.exclude: ["anonymous_access_denied"]
xpack.security.audit.logfile.events.emit_request_body: true
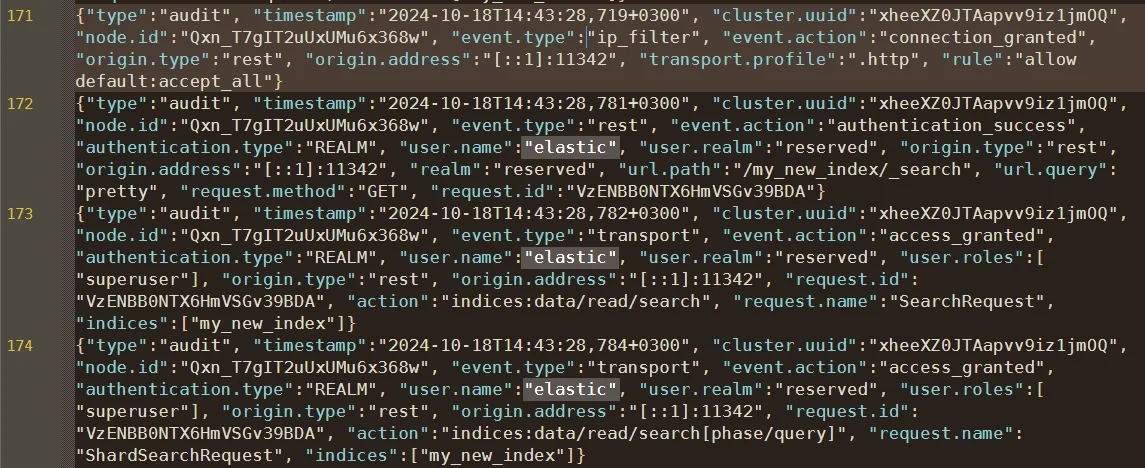
This setup records successful and failed authentication attempts, access outcomes, and includes request content when needed. For compliance-driven environments, capturing denied and administrative actions is crucial to show evidence of enforcement.
Step 3: Centralize and Analyze Audit Data
Audit logs are stored in the Elasticsearch logs directory, typically under /var/log/elasticsearch/.
You can forward them to Logstash, Beats, or external SIEM platforms for deeper analysis or retention in immutable storage.
Example configurations for centralization:
Forward audit logs to Logstash
input {
  file {
    path => "/var/log/elasticsearch/elasticsearch_audit.json"
    start_position => "beginning"
    codec => "json"
  }
}

output {
  elasticsearch {
    hosts => ["http://localhost:9200"]
    index => "elasticsearch-audit-%{+YYYY.MM.dd}"
  }
}
Ship audit logs via Filebeat
filebeat.inputs:
  - type: log
    enabled: true
    paths:
      - /var/log/elasticsearch/elasticsearch_audit.json
    json.keys_under_root: true
    json.add_error_key: true

output.elasticsearch:
  hosts: ["localhost:9200"]
  index: "audit-logs-%{+yyyy.MM.dd}"
Send logs to an external SIEM using syslog
sudo logger -t elasticsearch_audit -f /var/log/elasticsearch/elasticsearch_audit.json
These configurations enable centralized audit visibility and long-term evidence preservation, making compliance and investigation processes easier.
For guidance on secure log handling, see Database Performance for Audit Storage and Security Policies.
Filtering and Customization
Administrators can refine recorded events to match compliance requirements or reduce performance impact. For example:
xpack.security.audit.logfile.events.exclude: ["run_as_granted", "anonymous_access_denied"]
Filtered audit indices can also be shipped to Elastic Stack or external systems like SIEM, Splunk, or DataSunrise Database Firewall for centralized correlation and monitoring.
Learn how to strengthen Elasticsearch security through Database Firewall and Role-Based Access Control.
Enhancing Elasticsearch Audit Trail with DataSunrise
While Elasticsearch provides native logging, many enterprises require real-time analytics, compliance reporting, and correlation across multiple databases and cloud platforms. This is where DataSunrise complements native Elasticsearch audit features.
DataSunrise operates as a centralized data compliance and monitoring platform, unifying audit trails from Elasticsearch and other data sources while ensuring no performance impact on your production cluster.
Granular Audit Rules
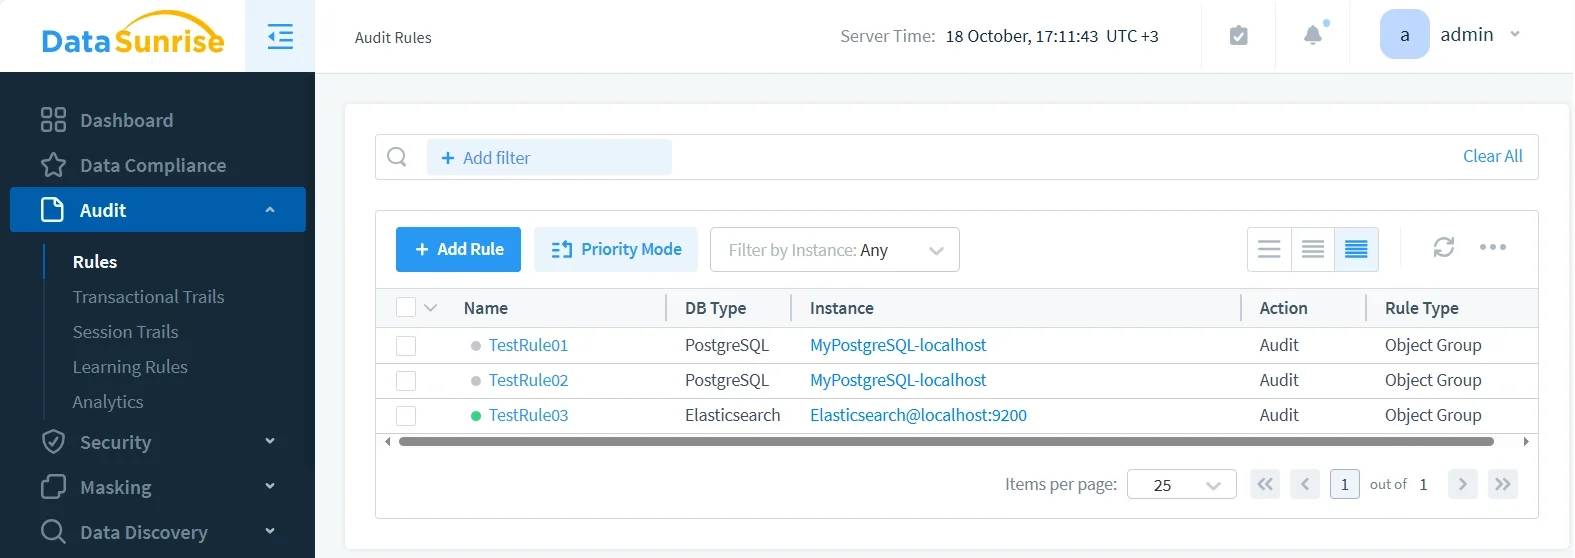
Granular Audit Rules in DataSunrise allow administrators to define precise audit policies by user, index, or specific action type.
This level of customization ensures that you capture only what truly matters—reducing storage overhead while preserving compliance-critical details.
For example, you can configure audit rules that:
- Track queries targeting sensitive indices such as
customer_dataorpayment_info. - Log administrative actions like index creation, deletion, or role changes.
- Filter out routine read operations that do not pose a compliance risk.
The result is a clean, focused audit log that simplifies analysis, accelerates investigation, and reduces total data retention costs without sacrificing visibility.
Database Activity Monitoring
Database Activity Monitoring in DataSunrise consolidates Elasticsearch activity with logs from PostgreSQL, MySQL, Oracle, and other supported databases.
This unified view provides comprehensive insight into your organization’s full data landscape.
Key capabilities include:
- Real-time visibility into every Elasticsearch query and index access event.
- Correlation of suspicious behavior across multiple systems, not just Elasticsearch.
- Consistent security policies across hybrid and heterogeneous data environments.
Centralized monitoring eliminates blind spots and provides continuous protection, ensuring compliance and operational transparency across all data platforms.
Real-Time Notifications
Real-Time Notifications in DataSunrise ensure that security teams are alerted instantly when risky or abnormal actions occur.
Notifications can be delivered through:
- Slack or Microsoft Teams channels for immediate collaboration.
- Syslog or SIEM integrations for centralized incident correlation.
- Email alerts containing contextual audit data.
Common scenarios include:
- Notifications when sensitive indices are queried outside business hours.
- Alerts triggered by multiple failed login attempts.
- Warnings about bulk exports or high-volume query executions.
These proactive alerts minimize detection time and accelerate the response process, helping teams address threats before they escalate.
Behavior Analytics
Behavior Analytics in DataSunrise applies machine learning to identify deviations from established user patterns.
It continuously learns typical access frequencies, query types, and behavioral baselines to detect anomalies before they cause damage.
Practical examples include:
- Detecting administrators exporting an index during unusual hours.
- Identifying sudden surges of search requests from a new or untrusted IP.
- Recognizing repetitive queries indicating data scraping or credential misuse.
By converting raw audit data into behavioral insights, DataSunrise enables proactive detection of insider threats and suspicious automation.
Automated Compliance and Reporting
With Compliance Manager, DataSunrise automatically aligns Elasticsearch audit data with frameworks like SOX, PCI DSS, and HIPAA.
The platform generates audit-ready reports containing:
- Complete access and change history.
- Configuration evidence with timestamped records.
- Policy enforcement logs and alert summaries.
This automation removes the need for manual log review and simplifies preparation for internal and external compliance audits.
For more insights into DataSunrise compliance automation, explore Data Compliance Regulations and Compliance Autopilot.
Business Impact
Deploying DataSunrise to manage Elasticsearch audit trails provides measurable benefits across IT, compliance, and security operations:
| Business Area | Impact |
|---|---|
| Compliance Readiness | Automated report generation reduces audit preparation time by up to 80%. |
| Operational Efficiency | Unified monitoring interface consolidates Elasticsearch logs with other data sources. |
| Data Protection | Behavioral analytics prevent exposure of sensitive content. |
| Incident Response | Real-time alerts accelerate reaction to unauthorized access attempts. |
| Scalability | Seamless integration across multi-node clusters, hybrid clouds, and on-prem deployments. |
Conclusion
An Elasticsearch audit trail is essential for maintaining data transparency, detecting anomalies, and ensuring compliance across modern infrastructures. However, native tools often fall short of enterprise demands for real-time analysis and cross-platform visibility.
By integrating DataSunrise, organizations gain a unified view of Elasticsearch activity, automated compliance checks, and fine-grained audit policies—all from one platform.
For enhanced data protection, review related topics such as Data Security, Data Protection, and Data Discovery.
This combination ensures your Elasticsearch environment remains both secure and verifiably compliant.
Protect Your Data with DataSunrise
Secure your data across every layer with DataSunrise. Detect threats in real time with Activity Monitoring, Data Masking, and Database Firewall. Enforce Data Compliance, discover sensitive data, and protect workloads across 50+ supported cloud, on-prem, and AI system data source integrations.
Start protecting your critical data today